

Drilling down with a Skew-T
- Dr. Scott Dennstaedt

- Dec 23, 2019
- 3 min read
Updated: Oct 7, 2021
There's no doubt that a pilot weather report (PIREP) for extreme turbulence should get your attention. Here's an urgent report from the crew of an Embraer E175 flying over northeastern Alabama at flight level 290.

Fortunately there were no injuries or damages, but what might have been causing this kind of turbulence and to what extent could that possibly extend to higher or lower altitudes? Well, let's drill down using the Skew-T log (p) diagram to find out.
Below is the sounding analysis nearby the location of the PIREP. The image is below is zoomed on the upper troposphere in order to see details of the winds and temperature...both are important to assess the potential for turbulent mixing. There are a lot of changes in wind speed, wind direction and lapse rate going on within about a span of a few thousand feet.

Notice the winds at FL290 are 134° at 15 knots. That's the flight level of the aircraft. But also take a look at the blue wind speed trace on the right. The winds rapidly decrease and then rapidly increase. They also have a rapid shift in wind direction from 007° at 20 knots to 036° at 7 knots to 134° at 47 knots. Just in the span of 3,000 feet the winds shift direction from north to southeast.
Also notice that all this occurs as the lapse rate in the atmosphere is highly unstable at 3°C/1,000 feet (the dry adiabatic lapse rate). Then just as the winds shift, the lapse rate lessens. Air is more likely to mix when unstable. Mixing leads to turbulence. Given the lapse rate, change in wind speed and wind direction, this was the perfect set up for a significant turbulence event.
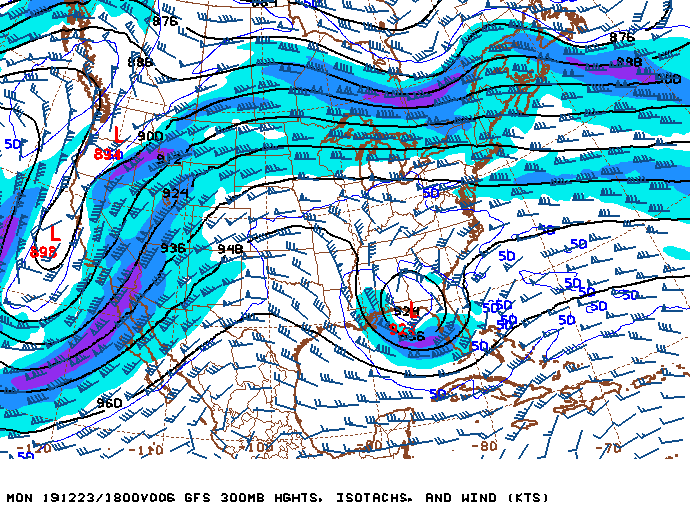
The Skew-T diagram is a great drill down tool, but it's absolutely necessary to understand the synoptic overview as well that provides you with the big weather picture. The turbulence in northeastern Alabama is all courtesy of what is called a split flow pattern that can be seen in the 300 mb (~30,000 feet MSL) constant pressure chart above. The northern branch of the flow is generally zonal (west to east) and rather strong up through the Great Lakes region. There's a closed upper level low in the Southeast that is the southern branch of the split flow. Notice on the northern edge of the upper level low, the winds change direction and speed rather quickly over a fairly small region giving rise to the potential for significant turbulence.

That urgent report got the attention of the forecaster at the Aviation Weather Center (AWC). As you can see from the text below, a SIGMET was issued at 2009Z primarily due to the extreme turbulence report above that occurred at 1945Z. Also notice the SIGMET suggests the turbulence would be between FL250 and FL340 which matches the discussion above.
WSUS04 KKCI 232009
DFWO WS 232009
SIGMET OSCAR 1 VALID UNTIL 240009
SIGMET
TN AL NC SC GA
FROM 20SSW BWG TO HMV TO 50SE IRQ TO LGC TO 40WNW MSL TO 20SSW
BWG
OCNL SEV TURB BTN FL250 AND FL340. DUE TO WNDSHR ASSOCD WITH
JTST. RPTD BY ACFT. CONDS CONTG BYD 0009Z.
In the end, even without the urgent pilot report or SIGMET, it's clear from the split flow regime that turbulence might be likely. Then using the Skew-T to drill down along your route will help you see the magnitude of a potential turbulence event in the making.
Most pilots are weatherwise, but some are otherwise™
Dr. Scott Dennstaedt
Weather Systems Engineer
Founder, EZWxBrief™
CFI & former NWS meteorologist


Comments