

An icing signature on the Skew-T you should remember!
- Dr. Scott Dennstaedt

- Feb 6, 2021
- 6 min read
Updated: Oct 23, 2023
When departing out of an airport in any airplane, knowing the threat of icing is a key element to making good decisions.

Pilot weather reports or PIREPs are one of the best tools at diagnosing the potential for adverse weather including airframe ice. Here's a perfect example. As you can see here, this Mooney encountered moderate to severe rime ice at 14,000 feet MSL just southeast of the Great Salt Lake area. We'll discuss this later, but the fact that it was rime ice makes a lot of sense as well. But what if there wasn't such a PIREP? What's the best approach to diagnosing the potential for a dangerous icing situation? Well, first and foremost, it's understanding the big weather picture. But there's a lot going on in this area and the Skew-T log (p) diagram comes in handy as well if you know what to look for.
The Skew-T is an excellent drill down tool to explore the details that the big weather picture doesn't readily provide. For example, before departing (or upon arrival), it might not be a bad idea to check out the Skew-T for this area. The PIREP was offered at 21Z and here's the 1-hour forecast from the Rapid Refresh (RAP) model also valid at 21Z. Let's see if we can unpack all that is going on here...there's a lot.

First, as shown below, there's a nearly continuous saturated layer from 7,500 ft to 15,000 ft spanning a temperature range from -5°C to -19°C. Those are perfect conditions for airframe icing...saturated conditions in that perfect range we see the most occurrences of airframe ice.

But the devil is in the details. Notice there's a pretty significant dry layer above the tops as shown below. It isn't about the "dryness" of the layer above the saturated layer per se, but that the tops are marked by a decreased lapse rate (from 2.5°C/1000 ft to 1.0°C per 1000 ft) that is sufficient to keep air from rising and trapping moisture at the tops (as in stratocumulus clouds). These clouds tend to have their highest liquid water content within the top 1,000 feet of the layer.
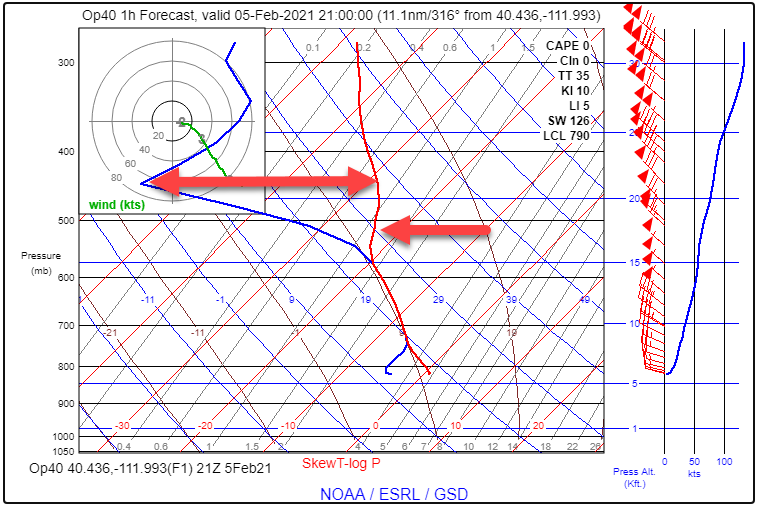
You will also notice below that the temperature range is nearly perfect for an encounter with airframe icing. The base of the cloud layer is roughly -6°C with the tops at approximately -20°C. With these rather warm cloud top temperatures, the cloud below is likely dominated by supercooled liquid water with the highest concentrations at the tops.

The real "signature" that should concern you is what's happening in the cloud itself. Notice below that the entire saturated layer matches or follows along with the dry adiabatic lapse perfectly. This is approaching moist absolute instability or what is the largest lapse rate Mother Nature can dish out when the air is 100% saturated (which it is here). When that occurs, the atmosphere has no choice but to squeeze out moisture in the column especially if there is some possibility of air rising in that column (we'll see that later).

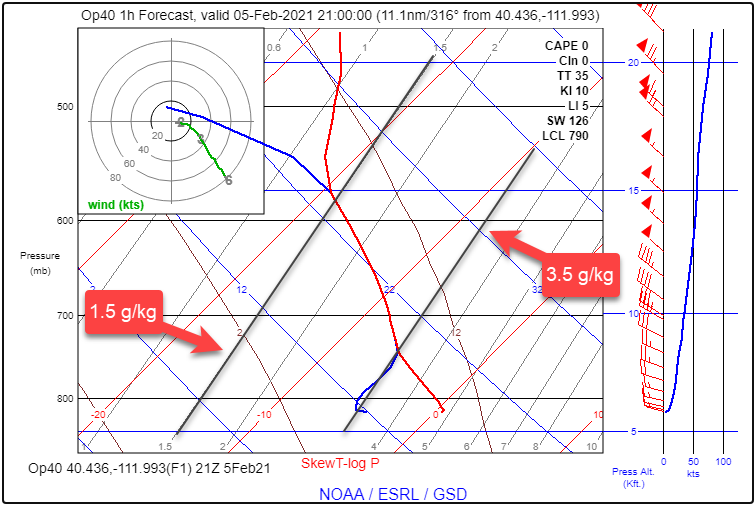
Even more, you can actually determine how much supercooled liquid water content (SLWC) can be squeezed out by using the saturation mixing ratio lines on this diagram. Below are two reference lines for the saturation mixing ratio for 1.5 g/kg and 3.5 g/kg that intersect the top and bottom of the cloud layer, respectively. Essentially if you "lifted" the air in this saturated layer, it could squeeze out a total of 3.5 - 1.5 or 2.0 grams of liquid water. According to the FAA Icing Design Envelopes 14 CFR Parts 25 and 29, Appendix C...
"In terms of icing intensity, a LWC of 0.5 g/m^3 requires about 7 minutes to deposit 1/4 inch of ice on the example airfoil."
So you can only imagine how much liquid water can be deposited on the airfoil with nearly 2 g/m^3 in this scenario.
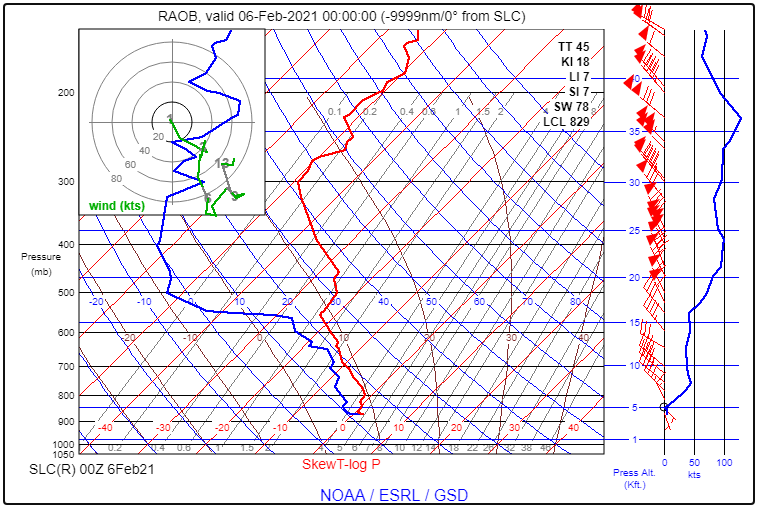
Now, in all honesty, the RAP model is likely overstating this quite a bit. It's hard to imagine that kind of SLWC in a cloud even with a good amount of lift. If you look at the radiosonde observation (RAOB) nearby from Salt Lake City from a weather balloon launched at 23Z, you'll notice below the temperature pattern is fairly close, but the saturation isn't quite as impressive, but not insignificant. There are likely a number of reasons for this such as localized differences, but it's common for the RAP model to suggest saturated conditions through the entire layer when that doesn't really occur naturally - there are typically "breaks" in those clouds with lower liquid water contents.
The other important point coming from the PIREP is that rime ice was reported. This makes perfect sense since the report came within the cloud tops where the drop sizes where likely within ice protection system certification standards. However, smaller drops at colder temperatures (in this case about -20°C), usually result in rime ice.
One of the things here that is critical is to understand the big weather picture and other supporting weather guidance. Let's start with the surface analysis chart valid at 21Z below. The area of the PIREP is in the purple circle. There's nothing really remarkable about this - no frontal zones nearby. So we need to look aloft to understand what might be going on.

The first thing to notice is a minor upper level disturbance that is moving into the SLC area by looking at the 500 mb chart which is roughly 18,000 ft MSL (valid at 00Z). There's a slight bend or dip in the overall trough pattern of the height lines and a vorticity maximum moving right over the Great Salt Lake. Also a bit of what is referred to as positive vorticity advection going on here right over the location of the PIREP. All of this and the little bit of upper level divergence that is occurring in this region will create some potential for lift especially as it relates to the orographic lift that may enhance rising air. With the moist absolute instability, a little bit of lift goes a long way.

In fact, you can clearly see this at 700 mb or roughly 10,000 feet MSL. In addition to relative humidity (green shading) there's also a field called Omega. Negative omega is in red and describes upward motion in the atmosphere whereas positive omega describes downward motion. It's not an "updraft" and "downdraft" kind of a motion but tries to describe where the air is more gradually ascending (or descending). Notice below that the PIREP is right on the edge of this ascending air giving more confidence the layer of clouds has some upward motion that can squeeze out the moisture.

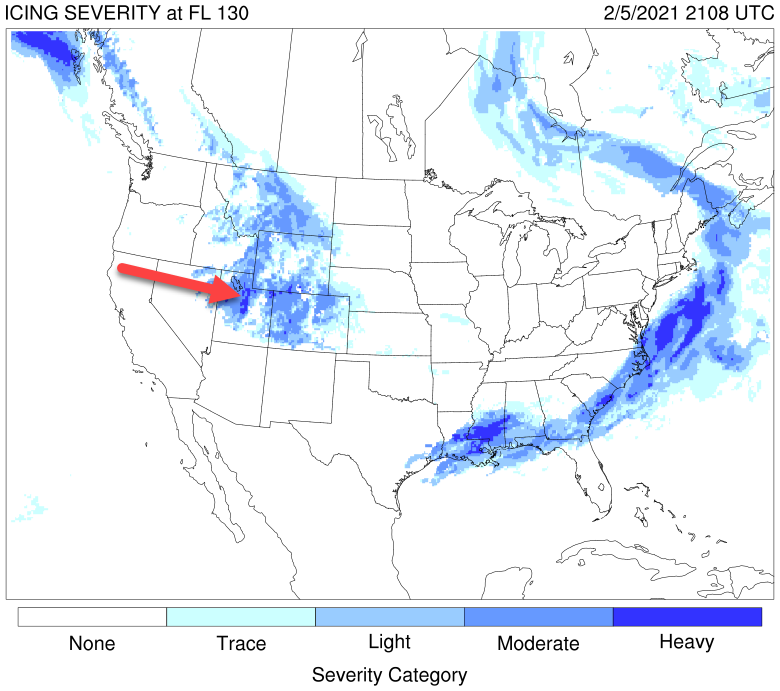
The Current Icing Product shows the possibility of heavy icing right near the location of the PIREP just southeast of the Great Salt Lake.
But as you can see below, the risk of SLD is either unknown or nearly zero although it does suggest above a heavy icing situation. Note that the CIP/FIP severity chart that overlays the SLD as a red-hatched region shows ANY chance of SLD...even as low as 5%. This chart shows very little chance at 14,000 feet.
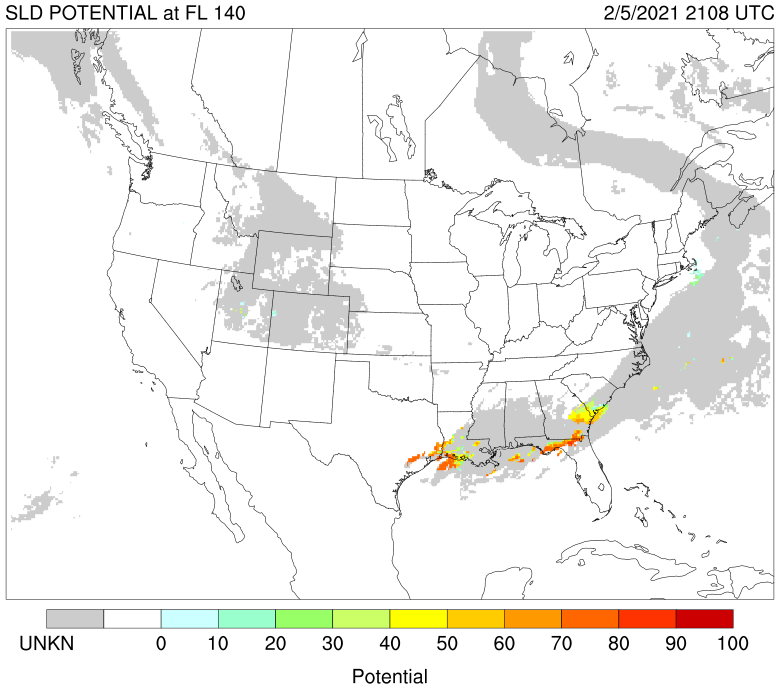
Another chart that depicts the liquid water contents that is very enlightening for this scenario and matches well with the discussion above shows the SLWC as fairly high (0.45 g/m^3) near the top of the cloud in that same area (12,000 feet). This is likely more reasonable than what you see in the Skew-T, but nevertheless shows a nasty icing environment.

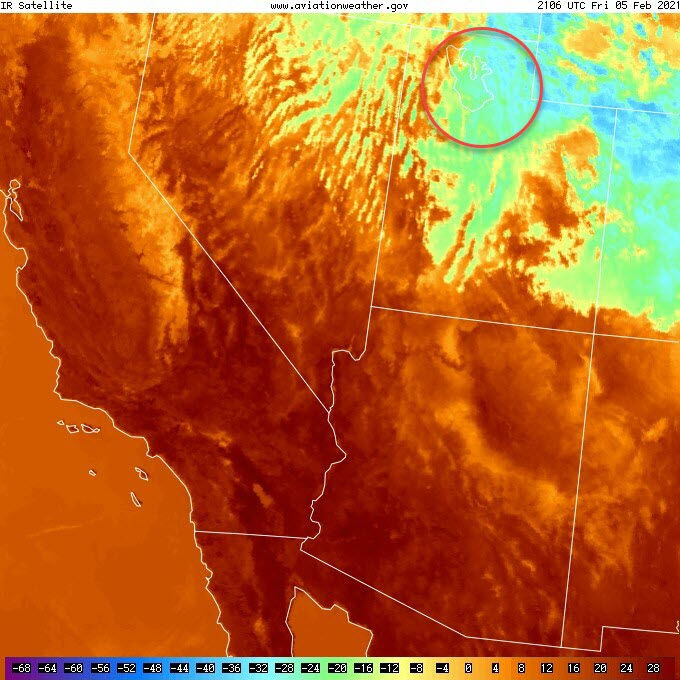
Looking at the IR satellite imagery for 21Z, it shows cloud top temps to have somewhat of a textured look and at the colors (pale green and light blue) are in the -20°C range representing the height of the clouds tops...pretty close to the height suggested in the Skew-T.
There was some precipitation moving through the SLC area moving into Provo with rain or rain showers and light snow (or more likely snow showers) reaching the surface at Salt Lake City. This also shows the effect of that upper level disturbance leading to a very juicy layer of clouds and precip. Finally, in the METARs notice the multiple cloud layers from the ASOS. This is a clear indication of a convective process in place which also drives up the potential for higher liquid water contents in the clouds.
KPVU 052156Z 08005KT 10SM -RA BKN036 OVC046 02/M02 A2996 RMK AO2
KPVU 052056Z 02007KT 10SM SCT040 BKN048 OVC055 03/M06 A2996 RMK AO2
KSLC 052105Z 15010KT 1 1/4SM -SN BR SCT029 BKN038 OVC048 01/M01 A2995
KSLC 052054Z 16009KT 2 1/2SM -SN BR FEW012 SCT040 OVC050 01/M01 A2995

Most pilots are weatherwise, but some are otherwise™
Dr. Scott Dennstaedt
Founder, EZWxBrief™
Weather Systems Engineer
CFI & former NWS meteorologist


Comments