

October 2025 EZNews
- Dr. Scott Dennstaedt

- Oct 2, 2025
- 12 min read

Hello and thank you for taking a few minutes to read the 54th edition of EZNews!

We appreciate those members who have opted for automatic monthly renewal of their EZWxBrief membership. If you haven't yet set up your account to renew automatically, please sign in and follow the prompts if your membership has expired. Otherwise, go to the User Profile page (see right) and tap or click on the Renew button. This allows you to set up your monthly renewal using a Visa, MasterCard, or Discover credit card (we do not accept American Express at this time), ensuring you continue to enjoy the simplicity of EZWxBrief.
It's just a little rain shower...
Sure, it's only a rain shower. But did you know that a rain shower is a form of deep, moist convection? It's true. Showery precipitation is essentially convection without lightning. Even so, it can pose a serious hazard with low IFR conditions, severe airframe ice, severe or extreme convective turbulence and low-level wind shear including microbursts. It should be strictly avoided just like you would avoid a mature thunderstorm.
Many rain showers manifest themselves as "low-topped" convection. That is, they are vertically-developed cumuliform-type clouds that don't penetrate well into the upper flight levels. This usually occurs when there's low-level instability capped by a fairly stable lapse rate (more on that later). Consequently, the ingredients for lightning don't exist in low-topped convection. In order for a rain shower to become electrified, supercooled liquid water, ice crystals and graupel all need to be present simultaneously in the cloud. If one of these ingredients isn't present in sufficient quantity, lightning isn't likely to be produced. Therefore, it's never a good idea to use lightning as a determining factor for whether it is safe to penetrate. Think convection, not thunderstorm!
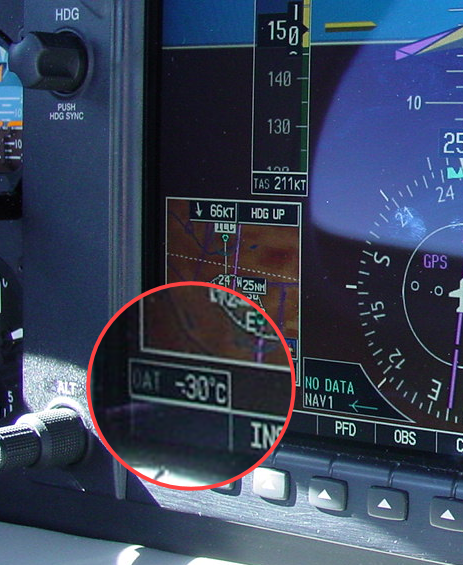
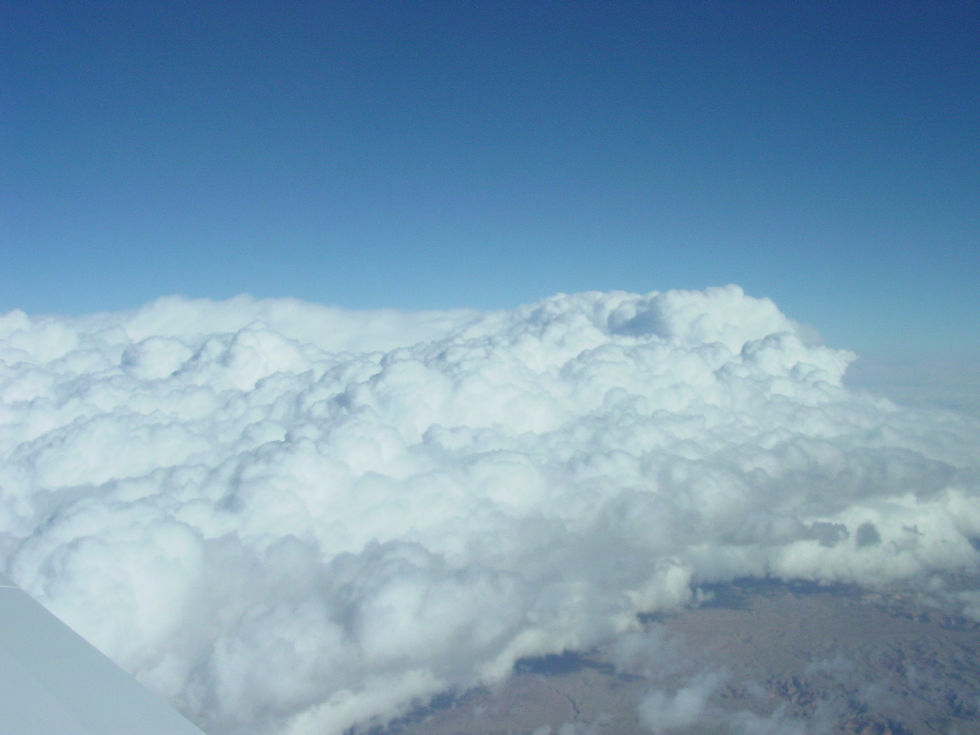
How do you know if convection will be low-topped or not? That's an extremely difficult question to answer with any consistency. There are going to be situations where an entire line or area can all be low-topped as shown in the picture above taken at FL220 over Utah at the end of October. Tops of this line were no more than 25,000 feet. In fact, much of the convection was at or below FL220. Given the rather cold cloud tops,-30°C in this situation, the ingredients for lightning were present and there were a few lightning strikes. But a majority of this area of low-topped convection was free of lightning.
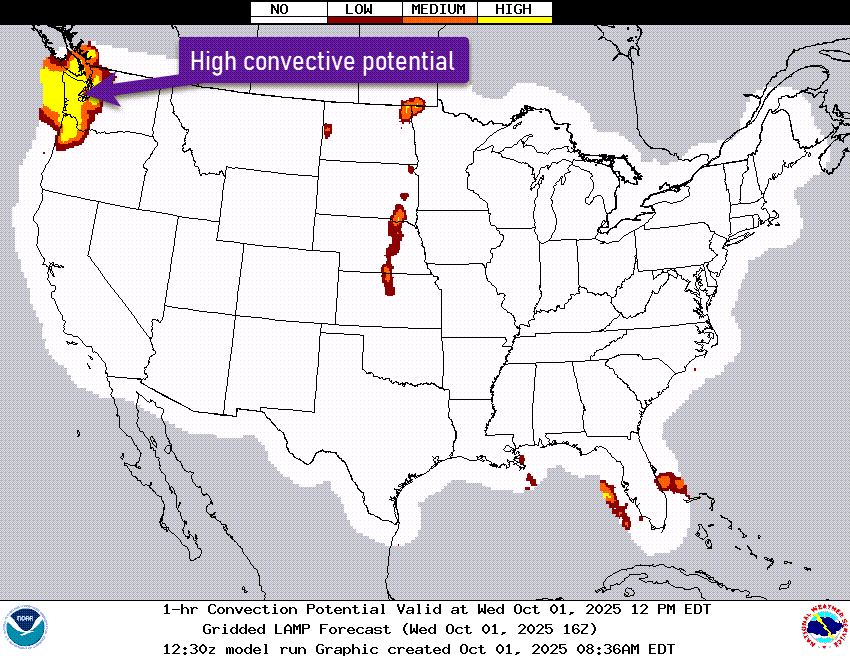
So how do you know if the convection will have low tops and no lightning? Some weather guidance that is extremely helpful comes from the Localized Aviation MOS Program (LAMP) convective potential forecast found in the EZWxBrief progressive web app static imagery collections. The LAMP guidance below valid at 16Z shows an area of high convective potential in the Pacific Northwest depicted in yellow. In this part of the world, low-topped convection is very common. Are these just some rain showers or perhaps thunderstorms?
It's also important to take a peek at the LAMP lightning potential guidance also available within the EZWxBrief progressive web app static imagery. The forecast below is valid at the same time and shows no lightning potential which is very common with low-topped convection.

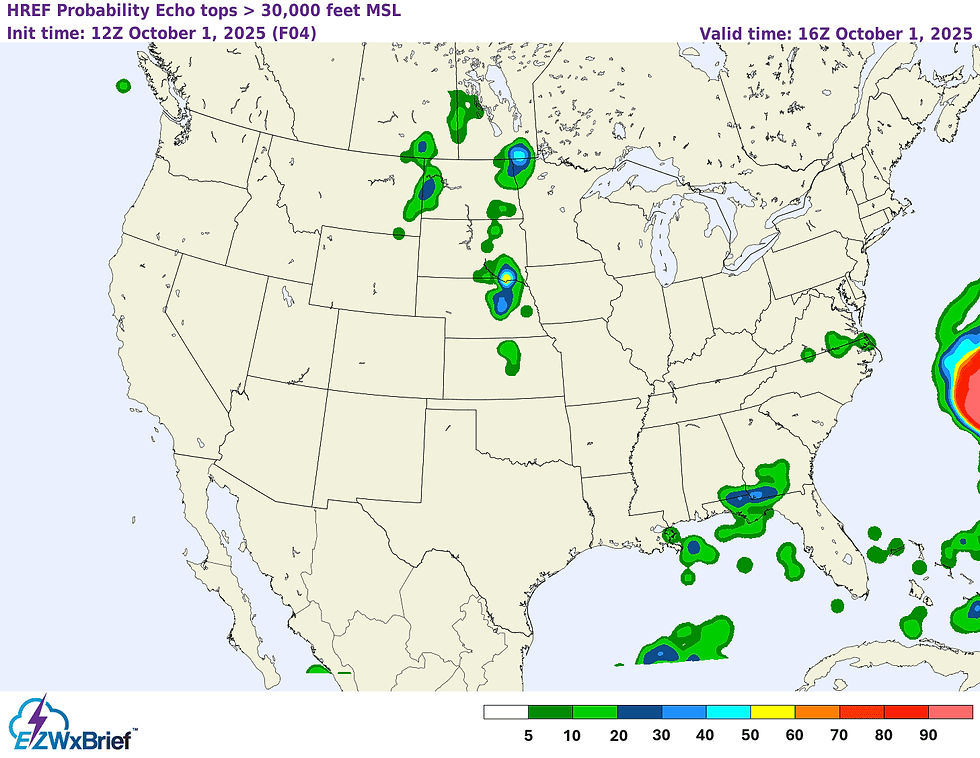
Another set of guidance that is very useful is the echo tops forecast from the High Resolution Ensemble Forecast (HREF) model also available in the EZWxBrief static imagery. The forecast below valid at 16Z, shows the probability that the echo tops (top of the precipitation core) will be greater than 30,000 feet. Certainly if there's a high chance the tops of the precipitation core will be above FL300, it is something you will want to avoid. Notice that at 16Z, the probability in the same region in the Pacific Northwest shows less than a 5% chance. This also confirms that any convection will be low-topped and will likely not contain lightning.
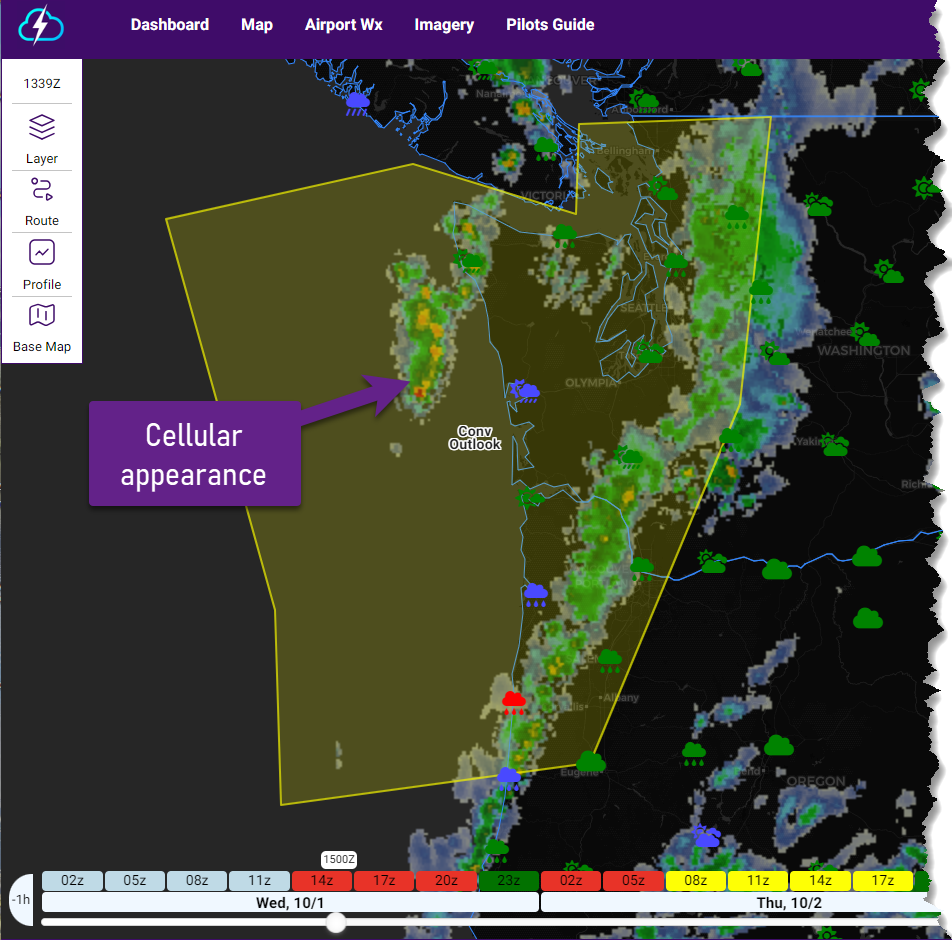
Even so, the Aviation Weather Center (AWC) issued a convective outlook valid from 15Z to 19Z that covers much of this region. This is shown as a yellow polygon below. This forecast implies that convection in this area is expected to develop that meets SIGMET criteria. Note that lightning is not one of the criteria used for the issuance of convective SIGMETs. Shown as another layer is the simulated reflectivity radar guidance from the High Resolution Rapid Refresh (HRRR) model. Notice the cellular-type appearance to the forecast returns. This is another indication that there's a convective process in place.
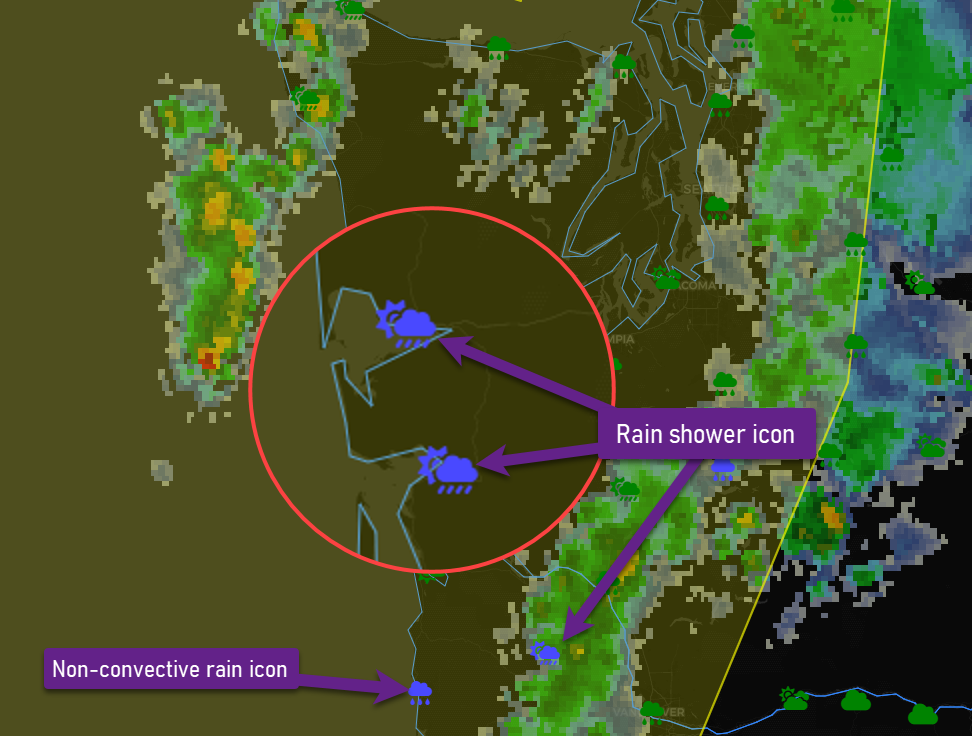
If we zoom in a bit, you will notice that a rain shower icon is depicted for the EZForecast Weather layer. The icon's color depicts the expected flight category for the airport; in this case the icon is blue implying marginal VFR (MVFR) conditions are forecast. When tapping or clicking on this icon, it will reveal a tabular display (not shown) that says, "Mostly cloudy with a chance of light rain showers and isolated thunderstorms." So if you are an EZWxBrief user, treat those shower icons as if they were a forecast for thunderstorms.
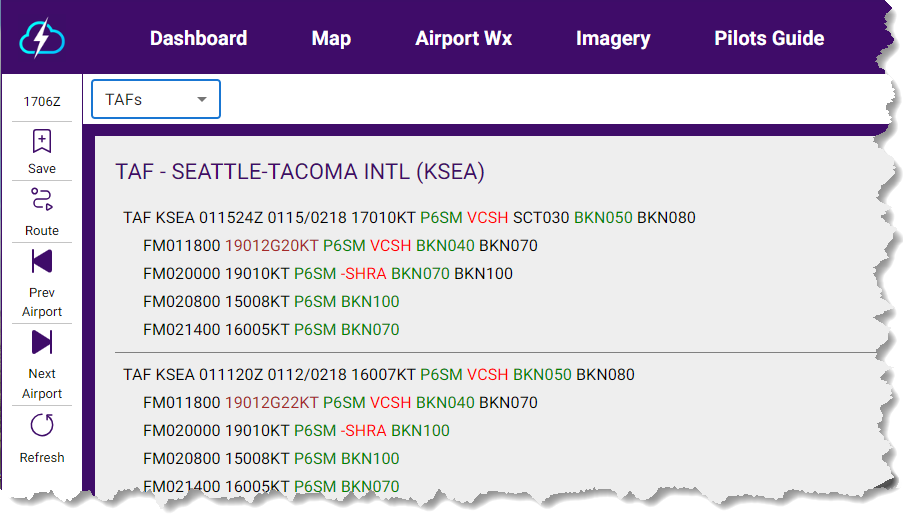
Of course, pilots are encouraged to look at the latest Terminal Aerodrome Forecasts (TAFs) in the region. The TAF for the Seattle-Tacoma International Airport (KSEA) shown below depicts the potential for showers in the vicinity (VCSH). This also reinforces the notion that convection is expected in the area.
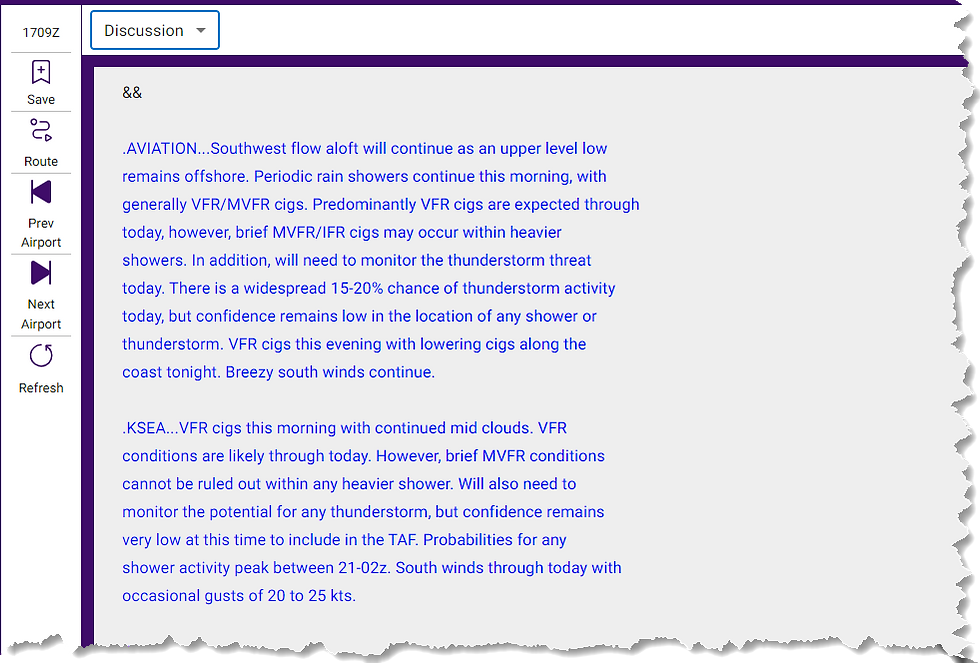
In order to better understand the details behind such a forecast, pilots are also encouraged to read the associated area forecast discussion (AFD) available in the EZWxBrief Airport Wx view. The one below was issued by the Seattle Weather Forecast Office (WFO). The discussion mentions, "...will need to monitor the thunderstorm threat today. There is a widespread 15-20% chance of thunderstorm activity today, but confidence remains low in the location of any shower or thunderstorm." Note the use of the word shower. So, given the low probability, the TAF only mentions rain shower in the vicinity. VCSH and SHRA are often used as a placeholder for a low-confidence thunderstorm event.
Eventually, the AWC did issue a convective SIGMET for a 30-mile-wide line of convection with tops to FL280.
WSUS33 KKCI 011655
SIGW
CONVECTIVE SIGMET 37W
VALID UNTIL 1855Z
WA AND CSTL WTRS
FROM 30NW TOU-10NNE HQM-70W HQM-70WNW TOU-30NW TOU
LINE TS 30 NM WIDE MOV FROM 23025KT. TOPS TO FL280.
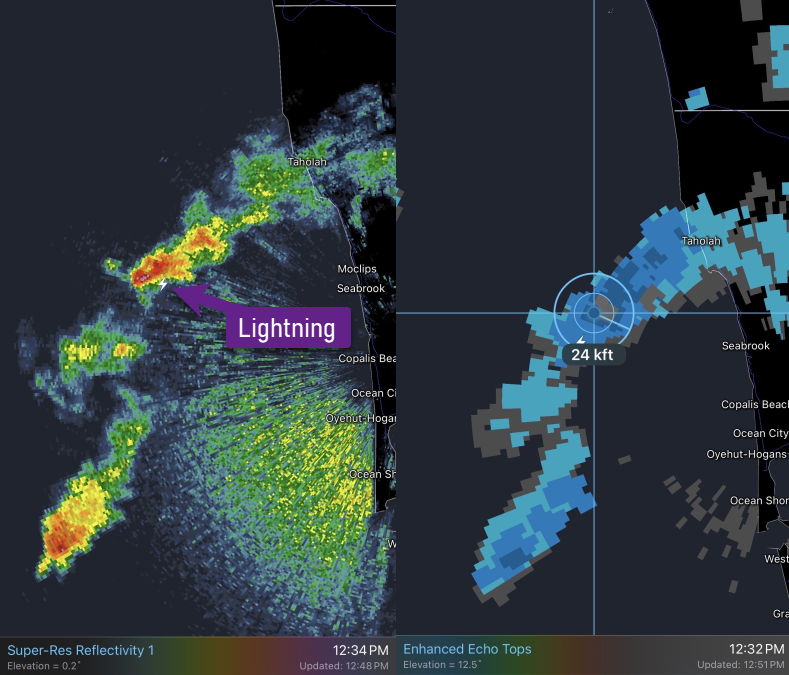
Looking at the radar depiction taken from the RadarScope app, there were a few intense echoes within several cells off the coast of Washington. Embedded in one of the intense cells in the middle of the image above (left) is one lightning strike. The enhanced echo tops radar depiction above (right) shows the echo top height at 24,000 feet. This is consistent with the guidance noted above.
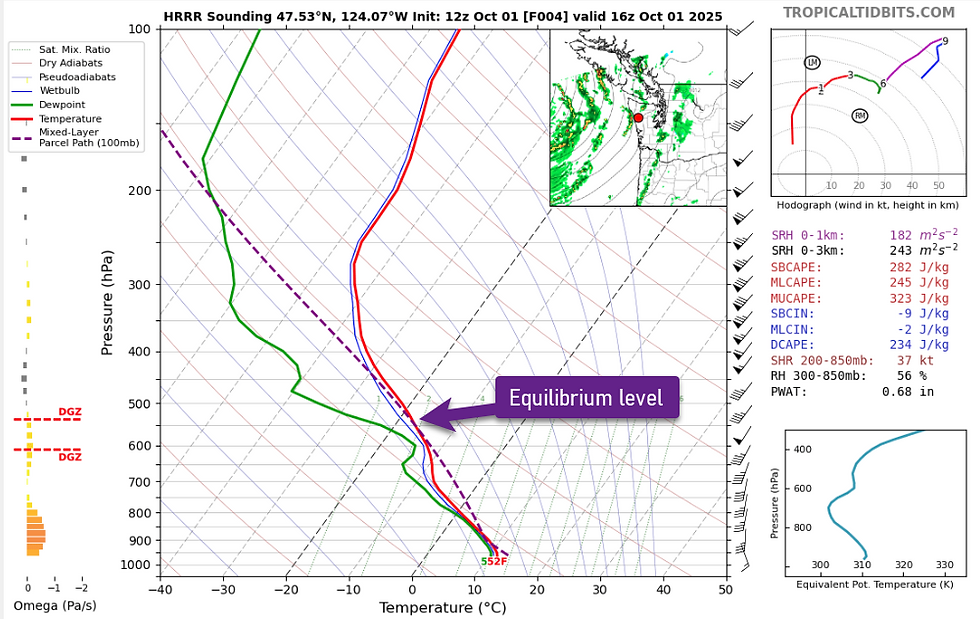
The reason for the low tops are due to a rather unstable mid-level lapse rate with more stable conditions above. Shown below is the 4-hour forecast sounding from the HRRR model showing a rather low equilibrium level (~500 mb or 18,000 ft). The EL is the point where the parcel lapse rate (purple dashed line) crosses over the environmental temperature (red line). Such a low equilibrium level limits the vertical growth of the convection. If updrafts in this convection are strong, the rising saturated air will often overshoot the equilibrium level by several thousand feet.
Weather prediction and artificial intelligence
Over the past few years, artificial intelligence (AI) has become a major topic in the news and on social media. It's not a passing trend; AI is set to influence our communication, creation, and governance in the coming decades. And you likely interact with AI on a daily basis. Nevertheless, combined with quantum computing, AI will significantly enhance weather prediction over the next decade. Although still in its early stages with many challenges ahead, AI is nearing the point where it will aid general aviation pilots in making routine operational decisions.
For nearly a century, weather prediction has been seen as a complex physics problem, where scientists use governing equations to model the physical environment. This theory-driven approach generates vast spatiotemporal datasets, covering the entire world and extending days, weeks, and even months into the future.
Numerical weather prediction (NWP) has been a challenge for scientists and computing professionals for nearly a century. Pilots benefit significantly from these forecasts, produced by powerful supercomputers. With the rise of AI and quantum computing, forecasts can now be generated much faster using new AI models.
Dynamical NWP models require extensive weather data, primarily from various sensors. Pilots recognize some of this data, such as METARs and SPECIs created from sensors located at airports. Additionally, models use data from radiosondes, satellites, aircraft reports, and ground-based radar like NEXRAD. This data is imperfect and sparse, particularly over our vast oceans, and therefore, doesn't fully cover the atmosphere we want to model. NWP models assimilate this data to create initial conditions known as an analysis, which act as a springboard to predict how conditions will evolve over time. This approach dates back to Lewis Fry Richardson in 1922, with the first computer-aided weather forecasts produced in 1950.
NWP has quietly revolutionized weather forecasting over the past 70 years, with incremental progress focusing on increasing spatiotemporal resolution. Higher spatial resolution in NWP models enhances the realism of weather forecasts, benefiting pilots. For instance, short-range forecast radar images are now available at five-minute intervals, similar to the NEXRAD radar mosaic. Pilots, skilled at interpreting ground-based radar, can effectively interpret these forecast images, which provide both quantitative information (e.g., intensity, timing, speed) and qualitative insights (e.g., bowing lines indicating strong winds or supercell structures suggesting severe thunderstorms).
The chaotic nature of the atmosphere means that small differences in initial conditions greatly impact forecast accuracy, especially for extended and long-range predictions. This is known as the "butterfly effect," as described by meteorologist Edward Lorenz, where small initial errors rapidly grow. Imperfect measurements and incomplete understanding of atmospheric processes introduce errors, leading to decreased accuracy as the time between initialization and prediction increases.
In 1966, meteorologist Jule Charney noted that deterministic modeling would limit accurate weather forecasts to about two weeks. This is logical, as forecasts become less reliable the further they extend from the initial conditions. Meteorologists have more confidence in a forecast valid 12 hours from the initial data than one valid 72 hours later.
In an article discussing the latest developments in AI, Scientific American stated, “AI tools are statistical models: they recognize patterns in training data sets composed of decades of observational weather records and information gleaned from physical forecasting. Thus, these models may notice that the weather setup of a certain day resembles similar events in the past and make a forecast based on that pattern.” Furthermore, AI is not only generating more accurate weather predictions but also requires a lot less computational power. Making 10-day forecasts with AI takes less than a minute compared to the hours needed when using a conventional deterministic model approach, that also employs a supercomputer with hundreds of processors.
The history of AI or machine learning (ML) and numerical weather prediction (NWP) differ significantly. Not long ago, neural networks were prominent in weather forecasting. The term "neural network" derives from how information is processed in the brain, like recognizing a grizzly bear and deciding to run. However, early neural networks for weather forecasts stalled due to insufficient computing resources and traditional ML methods proved suboptimal for these challenges.
Now, deep learning (DL), as a particular form of ML and AI, has achieved promising results in fields such as speech recognition, computer vision and other time-series problems. In recent years, DL has been applied to study these time series problems. Essentially, there’s a clear correlation between features that are obvious, but hard to identify. The goal of a DL method is to extract the necessary temporal and spatial features from these large datasets. Weather forecasting is essentially a highly sophisticated time-series problem with a rather large geospatial dataset.
DL revolutionizes weather forecasting by using a data-driven approach, relying on data instead of physical equations. It learns key relationships between input and output data by training on reference datasets. The question remains whether a pure AI-based model can fully replace the NWP model without any physical knowledge.
However, one of the major bottlenecks before a pure AI-based solution is possible is the availability of sufficient training data. Although a pure AI-based model is likely possible, the best practical results in the short term are most likely to be from a hybrid of NWP and AI techniques. This will also facilitate getting all those geeky research meteorologists doing the sophisticated physical modeling a bit more interested in using AI. That also will imply a new generation of scientists that will need to be trained to combine the AI and meteorology disciplines.
From a weather perspective, what can AI do for aviation? Most of the significant and practical advancements in weather forecasting with AI have been the extended-range forecasts. Pilots are most interested in what might happen in six hours and not as much what might happen in six days. In the next few years, you are not likely to see any groundbreaking improvement in turbulence, icing or cloud cover and ceiling forecasts that are purely generated by AI. Turbulence, for example, happens on the scale of the size of the aircraft that little or no training dataset for AI to learn.
AI excels at processing vast real-time data from satellites, radar, ground stations, and aircraft sensors to identify patterns and predict immediate changes. This capability is crucial for "nowcasting," which provides forecasts for the next few minutes to hours. Such forecasts are valuable for strategic and tactical aviation decisions, potentially including adverse weather predictions like turbulence, ceiling heights, and visibility.
Moreover, by predicting potential hazards with higher accuracy, AI empowers pilots to take proactive risk mitigation measures. This could involve suggesting alternative routes, recommending changes in altitude, or advising on appropriate departure/arrival times to avoid adverse conditions, ultimately leading to improved safety, especially in rapidly changing weather conditions.
A traditional weather briefing can be overwhelming with acronyms, raw data, and various charts. Through intelligent data synthesis and prioritization, AI can act as an assistant, sifting through NOTAMs, METARs, TAFs, and other information to synthesize it into a concise, easy-to-understand briefing. It can highlight critical information relevant to the specific flight (e.g., potential airframe icing at a certain altitude, a rapidly developing thunderstorm along the route), reducing the pilot’s workload and the chance of missing vital details.
Also, through personalized and adaptive briefings, AI can learn a pilot's preferences, experience level, and acceptable personal weather minimums. This allows for customized briefings that focus on the information most relevant to that pilot and their flight plan. For example, it could automatically flag conditions that exceed the pilot's risk tolerance or warn of anomalies based on their pre-set criteria (e.g., no flying over mountains at night).
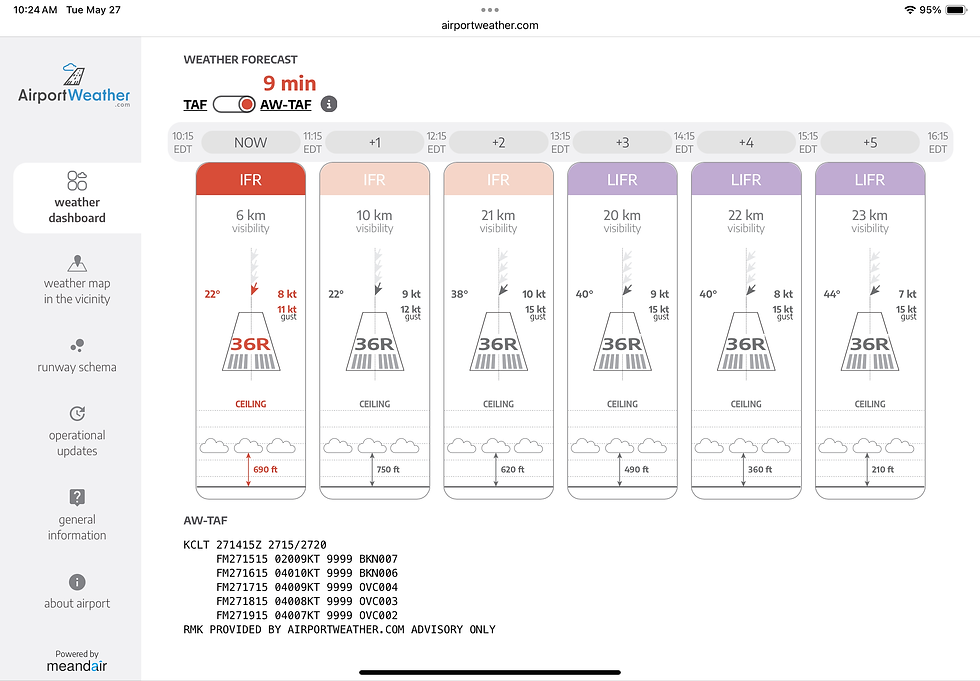
Though meteorologists generate TAFs, AI can enhance this by giving precise, frequent updates on airport conditions crucial for departures and arrivals. Services such as AirportWeather.com use AI to deliver ongoing, high-resolution AW-TAF (AI-powered TAFs) even at airports that are not serviced by a TAF.
A significant point noted in responses to recent advancements in weather forecasting is that this scientific practice has historically been considered a public good. The latest advancements in AI tools for weather forecasting have received mixed reactions, however. Many experts acknowledge their effectiveness while emphasizing that these tools will complement, rather than replace, traditional forecasting methods.
The potential for misinformation from AI-generated weather models is an ongoing issue. It is important to involve expert oversight to validate the forecasts and address any errors. In the end, AI is still not a substitute for human ingenuity and traditional weather forecasting methods that were developed over many decades and rigorously tested in many real-world contexts will still exist for many years to come.
There is growing concern about weather forecasting shifting from public to private ownership. AI has become indispensable, offering significant improvements, but it should assist, not replace, human judgment. AI acts as a co-pilot, not an autopilot; pilots must still understand weather phenomena and remain responsible for flight decisions.
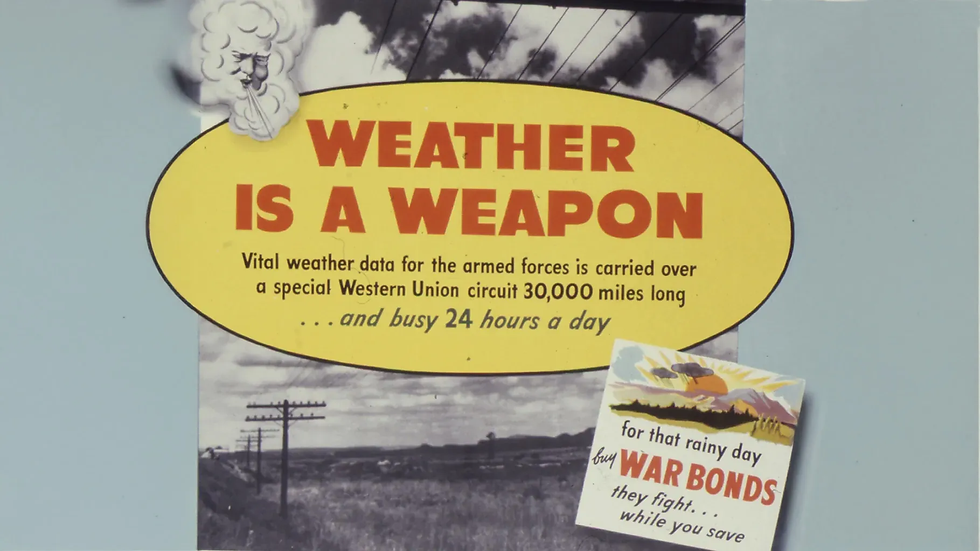
Weather as a weapon?
Did you know that the U.S. government actually censored weather information during WWII? It's true. On the morning of December 18, 1941, the Upper Midwest experienced a notable absence of weather information. Of course, weather information back then was not as ubiquitous as it is today. Nevertheless, the United States had just entered the war with Japan and Germany and meteorological data quickly became a military asset. In other words, you wouldn't hand the weather observations and forecasts on a silver platter and publish it for your enemies to use against you, right?
The United States Weather Bureau field offices (now your local Weather Forecast Offices) along Lake Michigan were among the first to limit their forecasts, restricting public access to barometric pressure readings, wind velocity and direction, and storm movement observations over the lake. In Muskegon, Michigan, the Weather Bureau merely predicted that the day would be “fair and colder.” In Chicago, the famous weather map at the Board of Trade went blank.
Less than a month later, access to these limited weather forecasts was further curtailed when the newly established Office of Censorship introduced its “Code of Wartime Practices” for the American press and broadcasters. Although these codes were technically voluntary, they were strictly enforced. Newspapers were restricted to publishing only official Weather Bureau forecasts, and only for areas within 150 miles of their location. Daily temperature reports were limited to no more than 20 cities at a time, and radio stations could only broadcast information when permitted. According to June guidelines, radio announcers were forbidden from airing “all weather data, including forecasts, summaries, recapitulations, or any details of weather conditions.” The West Coast faced even stricter U.S. Army regulations, requiring newspapers to delay reporting local weather for 24 hours.
During World War II, the United States wasn't the only nation to limit weather reporting, though the notion appeared ridiculous to many, even within the patriotic "Loose Lips Sink Ships" mindset of the war's early period. "You can't censor weather," one Weather Bureau employee remarked to a syndicated-news journalist. "It keeps right on happening." And indeed it did, with outcomes varying from amusing and inconvenient to costly and catastrophic.
EZWxBrief v2 News
EZWxBrief v2.0.3 is the current version. There have been no new releases at this point in time. A majority of the work over the last ten months has been to optimize the compute architecture to minimize the potential for any future cyber attacks. In fact, in the coming weeks, a brand new system architecture for EZWxBrief will be deployed to make the app more secure and run more efficiently. When this is deployed, there may be a brief time the app is unavailable.
The NWS has been planning to remove many of the model-based imagery over the next few months and to avoid interruption all of that static imagery had to be built from using the raw gridded-binary data. Doing this requires additional development and ongoing compute resources. Therefore, as of December 1, 2025, the EZWxBrief app subscription will be increased to $8.99 per month to help offset these costs and to help sustain EZWxBrief for another year.
Most pilots are weatherwise, but some are otherwise™
Your EZWxBrief sales team


Comments