

April 2026 EZNews
- Dr. Scott Dennstaedt

- Mar 31
- 10 min read

Thank you for taking a few minutes to read the 60th edition of EZNews!

We appreciate those members who have opted for automatic monthly renewal of their EZWxBrief membership. At this time there are no options to renew your membership annually. If you haven't yet set up your account to renew automatically, please sign in and follow the prompts if your membership has expired. Otherwise, go to the User Profile page (see right) and tap or click on the Renew button on that page. This allows you to set up your monthly renewal using a Visa, MasterCard, or Discover credit card (we do not accept American Express at this time), ensuring you continue to enjoy the simplicity of EZWxBrief.
The Skew-T log (p) diagram is back in the app!
As announced back in this blog post from October 2024, the NOAA soundings site was pulled from public view and would no longer be available in the EZWxBrief progressive web app. Of course, this didn't retire the Skew-T diagram itself. There are dozens if not hundreds of sites developed that could still render a Skew-T log (p) diagram. Nevertheless, given that EZWxBrief was using the NOAA site, the capability had to be temporarily removed. It has taken nearly 18 months, but the thermodynamic diagram called the Skew-T log (p) diagram is back within the app with some significant improvements over the NOAA site. Let's break down one feature at a time.

First, to find the Skew-T diagrams, open the Airport Wx view from the site menu (or Hamburger menu for handheld devices) or from the Dashboard (or you can launch this page from the Recent Airports list, Saved Items or from pressing any airport identifier in the Route Profile view). Next, as shown above, click on the Airport Wx dropdown menu and find the Skew-T item. Selecting Skew-T from this dropdown menu will replace the current view (in this case, the Meteogram view) and render the Skew-T log (p) diagrams for the selected airport (note, these are forecast soundings from the blend of models used to produce the EZForecast throughout the app).
The first diagram rendered will be valid at the top of the most recent hour. For example, if the current time is 1945Z, the first diagram rendered will be valid at 1900Z. Note that the time shown on the diagram is based on the Time Display chosen under General Settings, either Zulu or Local.

As shown above, below the diagram you will see a standard slider along with a Play/Pause button that allows you to loop through the available forecast soundings. Forecasts are available for a total of 48 hours from the time of the first forecast sounding. Pressing on the Play button will cause the forecast time to advance by one hour at a time. This will loop through all 48 forecast hours before restarting to the first sounding in the loop.
The slider can be manually moved to a different time by dragging the slider handle right or left. Also, pressing any part of the time slider will advance the time to that point. Either of these operations will expose a label above the slider handle that references the valid time of the forecast sounding at that point. If the Play button was pressed and time is advancing automatically, any manual operation of the slider will cause the loop to pause.

At the top of the diagram as shown above, the white label depicts the airport identifier and the valid time of the forecast sounding formatted based on the Time Display setting preferences. Listed below the valid time label are a few indices that include the surface-based convective available potential energy (SBCAPE), surface-based lifted index (SBLI), most unstable convective available potential energy (MUCAPE), lifted condensation level (LCL) of the most unstable parcel in feet above mean sea level (MSL) and the equilibrium level (EL) in feet above mean sea level (MSL).
The base lines included on the chart as shown below represent constant values for various thermodynamic variables and collectively form the base thermodynamic diagram. This acts as a specialized form of "graph paper" for plotting an atmospheric sounding, in this case, a forecast sounding. These include isotherms (°C), isobars (mb), pressure altitude (flight level), dry adiabatic lapse rate (°C), moist adiabatic lapse rate (°C) and saturation mixing ratio.
On the base diagram, the environmental temperature (red), environmental dewpoint temperature (green) and wind speed and direction are plotted as a function of pressure. Additionally, the 0°C isotherm is highlighted on the diagram in red given its relevance to airframe icing potential.

Also included on the diagram is a dashed yellow line that represents the parcel lapse rate. If MUCAPE is greater than SBCAPE, the most unstable parcel lapse rate will be plotted instead. Red-shaded areas are regions of positive buoyancy (CAPE) and green-shaded areas are regions of negative buoyancy referred to as convective inhibition (CIN). These areas will appear when SBCAPE or MUCAPE is greater than or equal to 1 J/kg.
Moreover, when hovering over the diagram with a mouse or running a finger over the diagram on a touch screen device, a cursor bar will appear that provides a data block or digital readout of the temperature (°C), dewpoint temperature (°C), wind speed (kts), and wind direction (barbs) at the pressure altitude (feet) selected.

Lastly, one of the most advanced features of the EZWxBrief Skew-T is the overlay of a categorical forecast for airframe icing and turbulence plotted as a function of altitude. Turbulence intensity category forecast (specifically clear air turbulence/convectively-induced turbulence) is plotted in the far left column (labeled EDR) and uses the same color pallet for light, moderate, severe and extreme turbulence as is depicted on the turbulence (TURB) meteogram and route profile views. Additionally, a categorical forecast for icing severity is plotted just to the right of turbulence (labeled SEV) and uses the same color pallet for trace, light, moderate and heavy as is depicted on the icing (ICE) meteogram and route profile views.

Moreover, the cursor bar will also show a data block that depicts the turbulence intensity and categorical icing intensity. For example, on the right, the cursor is set to 16,100 feet MSL and the turbulence EDR value is 36 and the icing intensity is M for moderate. In addition, T will be shown for Trace, L for Light and H for Heavy.
These two categorical forecasts have a maximum lead time of 18 hours as they are shown on the diagram. Therefore, when advancing the time beyond 18 hours those two columns will no longer be rendered. The labels of the EDR and SEV columns will be removed outside of the times these categorical forecasts are available. If the labels are shown but no forecast (color) is rendered in the column, this effectively means the turbulence intensity is less than light and airframe icing severity is not forecast for the given valid time.

Lastly, wind barbs are color-coded based on their relative wind speed. Any wind speed that is less than 100 knots will be coded as white. When the wind speed is 100 knots to less than 120 knots, the wind barbs are coded as yellow, Wind speeds from 120 knots to less than 140 knots, the wind barbs are coded as red. Finally, any wind speed that is 140 knots or greater, those wind barbs are coded as magenta.
Also, the wind trace is coded as a cyan color and when the cursor is active on the diagram, the wind barb for that specific altitude at the cursor will be highlighted in cyan.
To learn more about the Skew-T log (p) diagram consider purchasing a copy of the Weather Essentials for Pilots: The Skew-T Edition eBook.
Aviation only forecast discussion switch
Any time the area forecast discussion (AFD) is being shown in the Airport Wx view, an option to filter the discussion to only show the Aviation text is now available. By changing that switch to On (moving it right), this will filter out all of the forecast discussion except for the Aviation section shown in blue. If there isn't a forecast discussion (airport is outside of the U.S.) then this switch will not be rendered.

TAFs are now translated!
Now all terminal aerodrome forecasts (TAFs) are translated into plain English. Like surface observations (METARs) you will find a Translate switch when showing the latest TAFs (if any) for the selected airport. Move the switch to the right and it will translate the TAFs shown with the most recent TAF shown first.

New Map layers, SPC convective outlooks and SPC weather watches
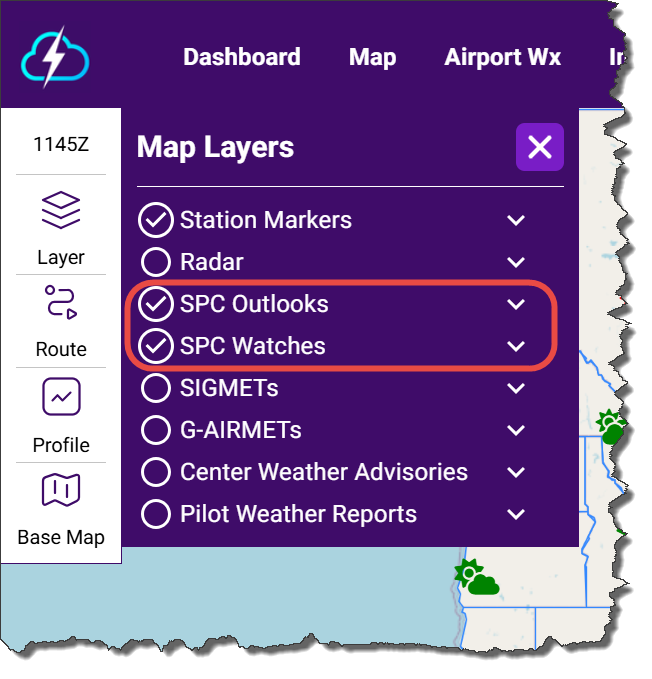
Now you have the option of adding the Storm Prediction Center (SPC) Day 1, Day 2 and Day 3 categorical convective outlooks as well as any severe thunderstorm or tornado watch boxes as new layers on the Map. These have be been always available in the static Imagery page, but now you can add these layers directly on the Map from the layer selector menu.
Day 1 means today, Day 2 means tomorrow, Day 3 is the following day. The Day 1 convective outlook is initially issued at 0600Z and updated four more times throughout the day to include 1300Z, 1630Z, 2000Z and 0100Z. When initially issued, the Day 1 outlook is valid from 1200Z today to 1200Z the following day. The Day 2 outlook is also initially issued at 0600Z and updated once at 1730Z. Lastly, the Day 3 outlook is issued at 0730Z and updated once at 1730Z. Similarly, the Day 2 and Day 3 outlooks are valid for a 24 hour period from 1200Z on the day it is valid to 1200Z the following day. Note that on any given day, there may not be any SPC outlooks issued due to the lack of convective activity.

Clicking or tapping on any outlook area will render a tabular pop up like the one shown above. This contains the valid time range, categorical risk (e.g., SLGT) and a brief overview what the risk level represents. In that pop up, pressing on the Discussion button will open up the latest SPC forecast discussion (e.g., Day 1, Day 2 or Day 3). Keep in mind, that these outlooks cover a wide range of time and most of the convection may not occur during time of your proposed flight. While this discussion is highly technical, it will often address the general timing of the convective event.
For the Day 1, Day 2 and Day 3 convective outlooks the Storm Prediction Center (SPC) uses a 5-level categorical scale (plus a general thunderstorm area) to describe the coverage, intensity, and confidence of severe thunderstorms (tornadoes, damaging wind, large hail). These categories are tied to probabilities of severe weather occurring within 25 miles of a point. Categories include TSTM (general non-severe thunderstorms), MRGL (marginal), SLGT (slight), ENH (enhanced), MOD (moderate) and HIGH (high) risk.
🟩 General Thunderstorms (TSTM)
What it means: Non-severe thunderstorms expected
Impacts: Lightning, heavy rain, maybe gusty winds—but below severe limits
Key idea: No organized severe weather expected in these areas
🟢 1. Marginal Risk (MRGL)
Coverage: Very isolated
Storm type: Weak/poorly organized severe storms
Impacts: Brief wind gusts or small hail possible; tornado risk is very low
Bottom line: Severe weather is possible but limited in duration and coverage
🟡 2. Slight Risk (SLGT)
Coverage: Scattered
Storm type: More organized storms
Impacts: Isolated tornadoes, damaging winds, and large hail
Bottom line: Multiple severe storms expected, but not widespread
⚠️ Important: “Slight” does not mean minor—significant severe weather can still occur
🟠 3. Enhanced Risk (ENH)
Coverage: Numerous
Storm type: Organized and more persistent
Impacts: Several severe storms, a few tornadoes, more widespread wind/hail damage
Bottom line: Higher confidence and coverage than slight risk
🔴 4. Moderate Risk (MDT)
Coverage: Widespread
Storm type: Long-lived, organized systems (supercells, squall lines)
Impacts: Several tornadoes (possibly strong), numerous severe storms, widespread damaging winds and large hail
Bottom line: Significant severe weather outbreak likely
🟣 5. High Risk (HIGH)
Coverage: Widespread and intense
Storm type: Major outbreak scenario
Impacts: Numerous strong/violent tornadoes, long-track tornadoes possible, widespread destructive winds (derecho potential)
Bottom line: High confidence in a major, potentially historic outbreak
Rare—issued only a few times per year (mainly on the Day 1 outlook). HIGH risk is not shown on the Day 3 convective outlook. At 72 hours out, there’s usually too much uncertainty to justify that level of confidence.
SPC Watches is another new layer that can be added to the Map. Severe thunderstorm or tornado watches (WW) are regions where active areas of severe thunderstorms including hail to 1 inch in diameter or greater, damaging surface winds and tornadoes are possible. Severe thunderstorm watch boxes are rendered on the Map as blue parallelograms with tornado watches shown as red parallelograms. Pressing on the watch box will pop up a tabular display providing the issuance time and when the watch expires. It also displays the AVIATION section that is part of the weather watch discussion.

G-AIRMETs for turbulence are changing...slightly
Effective April 30, 2026 at 1900Z, the Aviation Weather Center (AWC) is implementing the following change to enhance aviation safety, namely, a "mountain wave" descriptor will be added to the high-level (HI-TURB) and low-level (LO-TURB) turbulence polygons in the G-AIRMET product when mountain wave activity is associated with the turbulence flight hazard. The EZWxBrief progressive web app will pick up this new descriptor and will render this in the popup tabular display as Due to: Moderate mountain wave turbulence.
SIGMET and CWA advisories are changing...sort of
SIGMET, AIRMET (for Alaska only), Center Weather Advisory (CWA), and Meteorological Impact Statement (MIS) products are changing. As you may be aware, the FAA is transitioning the National Airspace System (NAS) to Performance Based Navigation (PBN). As a result, the VOR infrastructure in the conterminous U.S. is being repurposed to provide a conventional backup navigation service during potential GPS outages. This backup infrastructure is known as the VOR Minimum Operational Network (MON).
Currently, many NWS aviation weather products use VORs as reference points to identify hazardous weather areas. Due to the VOR MON transition, the number of reference points is being reduced, impacting the ability to adequately describe the hazard areas. Future products will use airport codes as reference points for depicting hazardous weather areas.
SIGMET current example using VOR reference points:
WSUS32 KKCI 221455
MKCE WST 221455
CONVECTIVE SIGMET 20E
VALID UNTIL 1655Z
ME MA NH CSTL WTRS
FROM 140SE BGR-100ESE ACK-50SE ACK-110ESE ENE-140SE BGR
AREA EMBD TS MOV FROM 22045KT. TOPS TO FL290.
SIGMET new example using airport code reference points:
WSUS32 KKCI 221455
MKCE WST 221455
CONVECTIVE SIGMET 20E
VALID UNTIL 1655Z
ME MA NH CSTL WTRS
FROM 120S EPM-100ESE ACK-50SE ACK-100SE PWM-120S EPM
AREA EMBD TS MOV FROM 22045KT. TOPS TO FL290.
There isn't a specific date announced when this will change go into effect.
TAF service to be discontinued for Castle Airport in Hanford, CA
Effective on May 19, 2026, at 1800Z, the NWS office at Hanford, CA, will discontinue routine TAF service for Castle Airport (KMER) in Atwater, CA.
Two temporary TAFs to be implemented for the World Cup
Effective June 13, 2026 at 1200Z, the NWS office in Miami, Florida will begin temporary TAF service for North Perry Airport (KHWO) in Pembroke Pines, Florida, to support the aviation community during the World Cup. After that date, routine and updated TAFs will be issued 24 hours a day until July 19 at 0000Z.
Also effective June 13, 2026 at 1200Z, the NWS office in Houston, Texas will begin temporary TAF service for David Wayne Hooks Memorial Airport (KDWH) to support the aviation community during the World Cup. After that date, routine and updated TAFs will be issued 24 hours a day until July 19 at 0000Z.
EZWxBrief v2 News
EZWxBrief v2.3.0, v2.3.1, v2.4.0, v2.4.1 and v2.5.0 were released in March. This includes bringing back the Skew-T log (p) diagram to the app. The release notes can be found here. If the app is open, sign out and close the app. Upon restart, you will have immediate access to the latest release.
Most pilots are weatherwise, but some are otherwise™
Your EZWxBrief product and sales team


Comments