

May 2026 EZNews
- Dr. Scott Dennstaedt

- Apr 30
- 8 min read

Thank you for taking a few minutes to read the 61st edition of EZNews!

We appreciate those members who have opted for automatic monthly renewal of their EZWxBrief membership. At this time there are no options to renew your membership annually. If you haven't yet set up your account to renew automatically, please sign in and follow the prompts if your membership has expired. Otherwise, go to the User Profile page (see right) and tap or click on the Renew button on that page. This allows you to set up your monthly renewal using a Visa, MasterCard, or Discover credit card (we do not accept American Express at this time), ensuring you continue to enjoy the simplicity of EZWxBrief.
Lots of new features were recently added to EZWxBrief in April described below. But as an honorable mention, this includes adding G-AIRMETs to the Route Profile and Meteogram views and increasing the EZDeparture Advisor™ time resolution from 10 minutes to 5 minutes. Also added was a Frontal Analysis layer to show the pressure centers and frontal boundaries for the most recent 12 hours (surface analysis) and those taken from the Weather Prediction Center (WPC) short-range prog charts.
New climb and descent profile


Since EZWxBrief v1.0 was released five years ago, all active routes started and ended at the cruise altitude. This, however, did not account for the performance attributes in the climb and descent to accurately predict the arrival times along the route and at the destination airport. More importantly, it did not take into consideration airframe icing and turbulence you may encounter in the climb and descent phases of the proposed flight. Now when planning a route, a climb and descent profile will be used to make all of the appropriate calculations. Consequently, the EZDeparture Advisor™ will evaluate whether or not you will encounter icing and turbulence during the climb and/or descent and evaluate those as part of your personal minimums in addition to what is expected during cruise flight. Moreover, you will see this profile rendered on the Route Profile view as shown above.
With this enhancement, you will need to define your climb and descent profile parameters to include airspeed in the climb, rate of climb, airspeed in the descent and rate of descent. If you have not done so already, take a minute to define all four of these in the Aircraft Settings for your aircraft as shown above.
New map layers courtesy of the NDFD
So what is the NDFD? The National Digital Forecast Database (NDFD) is the official nationwide digital weather forecast system that combines gridded forecasts produced by local National Weather Service forecast offices with national guidance from forecast centers into one seamless mosaic of digital forecasts. Instead of only issuing text forecasts, the NDFD provides weather information in map-ready grid form for thousands of locations across the U.S, including temperature, wind, sky cover, precipitation probability, weather type, snow amounts, humidity, and other forecast elements of interest to pilots (e.g., ceiling height and surface visibility).

These grids are updated frequently as forecasters make changes, and they power many public products such as forecast maps, point-and-click forecasts on weather.gov, mobile apps, emergency management tools, and commercial weather services. Shown on the right is a forecaster at the Greenville Spartanburg WFO (GSP) entering the gridded forecasts that are eventually ingested into the NDFD.
Most importantly, these forecasters are often the same as those who issue the terminal aerodrome forecasts (TAFs). This means that the NDFD Weather grids should be closely aligned with the TAFs.

You will find these new layers under NDFD Weather as shown on the left. Pressing the downward pointing chevron on the right will present a list of NDFD Weather layer attribute filters to include Precipitation Type, 6-hour QPF, Ceiling Height, Surface Visibility, Surface Wind Speed and Surface Wind Gust. Except for the Points Labels, these layers are mutually exclusive such that selecting one will deselect the other. Since these are considered forecasts, they will not be available when the EZDeparture Advisor™ is set to a time in the past when viewing the Map.
Just to note that the EZForecast presented in the Station Marker layer could be different than the NDFD Weather forecast since they are derived using different sources.

Although there is a legend provided at the top of the Map when the layer is selected, the NDFD Weather layers has a convenient overlay called Points Labels that will quickly allow you to estimate the values for many locations for the layer rendered on the Map. For example, shown on the right, the Precipitation Type will provide labels for precipitating weather such as R for rain, RW for rain showers, T for thunderstorms and non-precipitating weather such as F for fog, K for smoke and BL for blowing dust/sand/snow). While not guaranteed in all cases, these labels are usually placed nearby airports as well as populated cities or towns. See the Pilots Guide for additional details that describes the various NDFD Weather layers.
New TAFs layer

In addition to the Station Marker layer that provides point observations (METARs) and point forecasts (EZForecast) depending on the time set on the EZDeparture Advisor™, a new Terminal Aerodrome Forecast (TAF) layer has been added to the Map and is mutually exclusive with the Station Markers layer. This layer will have a similar look and feel as the Station Marker layer and includes attribute filters to include Flight Category, Ceiling Height, Surface Visibility, Surface Wind Speed, Surface Wind Gust, Wind Barbs and Weather. Clicking on the TAF marker will render a tabular forecast display like that shown on the right that translates the coded TAF valid at the time set on the EZDeparture Advisor™. Moreover, below the tabular display clicking on the Visit Airport button will open the selected airport in the Airport Wx view.
New Frontal Analysis layer

The latest surface analysis and short-range prog chart forecast issued by meteorologists at the Weather Prediction Center (WPC) are now available as a new Map layer. This layer includes the surface analysis charts for the previous 12 hours as well as the short-range forecasts over the next 72 hours. Features presented in this layer include cold fronts, warm fronts, occluded fronts and stationary fronts as well drylines, surface pressure troughs and high and low pressure centers for the conterminous U.S., southern Canada and Mexico. Note that troughs can represent a surface trough, outflow boundary, squall line or dryline. For a more detailed frontal analysis , please visit the Surface Analysis and Prog Chart static Imagery.
New Winds Aloft layer

A new Winds Aloft forecast layer was added to the Map that includes a representation of standard wind barbs (shown right) as well as a wind particle animation. These two layers are mutually exclusive with each other. That is, when one is selected, the other will be deselected. When the Winds Aloft layer is selected, a new Altitude selector will appear on the right side of the Map to filter the winds aloft forecast by altitude from 1,000 feet to FL450 (45,000 feet MSL). Both of these layers represent the same forecast as is provided in the Meteogram and Route Profile WIND view.
Editing of the active route on the Map

Editing the route can now be done without the route editor through rubber banding. Rubber banding is simply a way to edit the active route using a drag and drop gesture. With any active route rendered on the Map, you can now grab the magenta route line using a mouse or your finger on a touch screen and then drag and drop it to a new location. At the point where the route line is dropped, the five nearest waypoints will be listed. The selected waypoint will be added to the route of flight. Moreover, you can also press and drag any route waypoint (including the departure and destination airport) from the active route to a new location on the Map. This will effectively change the route without a need to use the Route Editor. Lastly, pressing any route of flight waypoint will allow you to delete that waypoint from the route of flight.
Turbulence and Airframe Icing layers
The same turbulence and icing forecasts found on the Meteogram and Route Profile views is now available to be rendered as a layer on the Map. The turbulence layer has three attributes that include Clear Air, Mountain Wave and Combined. Clear Air includes both clear air turbulence and convective-induced turbulence. These are all mutually exclusive selections. Moreover, when the Turbulence layer is selected, a new Altitude selector will appear on the right side of the Map to filter the turbulence forecast by altitude from 1,000 feet to FL450 (45,000 feet MSL).
Airframe icing layer includes probability, severity and SLD. Just like is allowed with the Meteogram and Route Profile views, you can overlay the SLD layer on the icing severity layer. Moreover, when the Airframe Icing layer is selected, a new Altitude selector will appear on the right side of the Map to filter the icing forecast by altitude from 1,000 feet to FL300 (30,000 feet MSL).
Flight modes

There are two flight modes available on the Map. This includes a basic Flight Mode and one that incorporates the Skew-T log (p) diagram. The two Flight Mode buttons are shown on the right. This is a way to see how your proposed route intersects with the weather as the flight progresses for a given departure time. Flight Mode is only available when there is an active route and the EZDeparture Advisor™ is set to a time in the future.
To enter the basic Flight Mode simply press the button with the airplane icon. This locks in the departure time currently set on the EZDeparture Advisor™. The EZDeparture Advisor™ time slider handle will change to purple and the slider will be clamped to this departure time for the left-most position and the right-most position will be clamped at the expected time of arrival at the destination as determined by the aircraft’s true airspeed during the climb, enroute and descent, and if enabled, the winds aloft forecast.

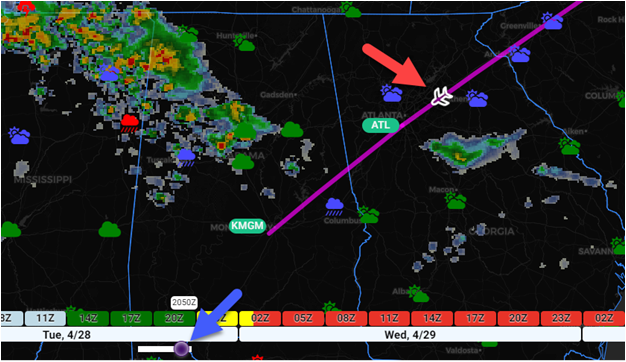
When the basic Flight Mode button is pressed, a generic airplane icon will appear at the departure airport. Advancing the abbreviated slider forward in time (blue arrow below) will cause the airplane icon to “fly” the active route (red arrow below). More importantly, the underlying weather layers will also advance in time accordingly. This is a way to see how your proposed flight will intersect expected weather along the route. Shown below, the forecast radar is rendered on the map in addition to the TAF markers.
Additionally, there is also the Skew-T Flight Mode. This has the same characteristics as above, except it also renders a Skew-T log (p) diagram over the Map. This is initiated by pressing on the button immediately below the basic Flight Mode button.
As the clamped EZDeparture Advisor™ is advanced, the Skew-T diagram will update based on the location of the flight and time. Just like the Airport Wx counterpart, the Skew-T is interactive and includes the cursor bar as well as showing the various parcel indices, parcel lapse rate and regions of SBCAPE/MUCAPE (red shading) and SBCIN (green shading).

Some static imagery decommissioned
There were several static imagery collections that were retired from the Imagery view in the app since these collections are now available as layers on the Map. These include the MRMS Composite Reflectivity, Icing and Turbulence collections. If any of these collections appear in a Saved Items folder or in Recent Imagery, they will be removed from the Saved Items and Recent Imagery the next time they are selected to be viewed.
EZWxBrief v2 News
EZWxBrief v2.6.0, v2.6.1, v2.7.0, v2.8.0 and v2.9.0 were released in April. The release notes can be found here. If the app is open, sign out and close the app. Upon restart, you will have immediate access to the latest release.
Most pilots are weatherwise, but some are otherwise™
Your EZWxBrief product and sales team


Comments